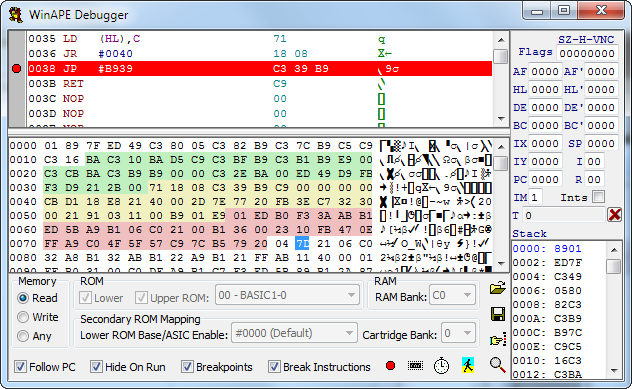
Using the Debugger
WinAPE features a fully integrated Z80 debugger. This allows you to pause the emulation at any time, examine or modify the values of Z80 registers, view the running Z80 program and edit, load and save regions of emulator memory.
To start the debugger at any time while the emulator is running, click the pause button
 or press F7 or F8.
To resume emulation click the play button
 or press F9.
While in debug mode the F7 key allows you to single step through executing Z80 instructions. Pressing this key will execute a single instruction or part of an instruction. Single stepping repeating instructions (eg. LDIR, LDDR) will cause one execution cycle of that instruction to be performed. Single stepping through CALL instructions will continue stepping into the called location.
The F8 key allows you to step over certain instructions. Step over works in much the same way as single stepping, but repeating instructions are executed as a whole, and CALL instructions are not followed, but performed. If the F8 key is pressed with a CALL instruction which does not return to the address immediately after the call instruction the emulator will continue to run until it is paused, the F8 key will be disabled.
The F4 key allows the emulator to run until it reaches the currently selected instruction in the Disassembler Pane.
The debugger disassembly, memory and stack values displayed are in the region of memory currently selected in the Memory Selection section of the debugger.
Multiple breakpoints can be set and the emulator will stop and enter debug mode whenever these instructions are reached.
The T value is a representation of the current number of elapsed microsecond cycles since the last time the value was reset using the adjacent button.
The Follow PC check box causes the disassembler pane to follow the current Program Counter (PC) value.
The Hide On Run check box causes the debugger to be hidden when the emulator leaves debug mode and resumes running normally.
The Breakpoints check box allows all breakpoints to be enabled or disabled with a single click.
The Break Instructions check box allows WinAPE to use a special BRK instruction (ED FF) as a breakpoint.
The
 button displays The Breakpoints
Window, allowing breakpoints to be modified and have conditions set.
button displays The Breakpoints
Window, allowing breakpoints to be modified and have conditions set.The
 button displays The Data
Areas window, allowing areas of emulator memory to be marked as data and displayed using
db or dw instructions in the disassembler.
button displays The Data
Areas window, allowing areas of emulator memory to be marked as data and displayed using
db or dw instructions in the disassembler.The
 button displays the Timers window,
which shows Timers which have been used in Breakpoints.
button displays the Timers window,
which shows Timers which have been used in Breakpoints.The
 button displays the The Graphics
Finder window, allowing areas of memory to be viewed and edited graphically.
button displays the The Graphics
Finder window, allowing areas of memory to be viewed and edited graphically.The
 button loads a file to the currently selected location in the
Memory Dump Pane.
button loads a file to the currently selected location in the
Memory Dump Pane.The
 button saves the currently selected region in the
Memory Dump Pane to a file.
button saves the currently selected region in the
Memory Dump Pane to a file.The
 button allows you to position either the disassembler pane or
memory dump pane to a specific address, depending on which was last clicked.
button allows you to position either the disassembler pane or
memory dump pane to a specific address, depending on which was last clicked.The
 button allows you to find data
in memory starting at the address selected in either the disassembler pane or
memory dump pane, depending on which was last clicked.
button allows you to find data
in memory starting at the address selected in either the disassembler pane or
memory dump pane, depending on which was last clicked.For more information on each section see:
The Disassembler Pane
The Memory Dump Pane
The Stack Pane
The Breakpoints Window
The Data Areas Window
The Graphics Finder
The Register Window