The Memory Dump Pane
The Memory Dump pane allows you to view, edit, load, save or search regions of the running CPC emulator memory.
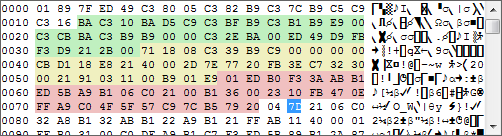
Each line represents 16 bytes of memory. The first four digits are the start address for the line, the second section contains 16 hexadecimal numbers showing the value of the 16 bytes from the given start address, and the third section is an ASCII representation of the same 16 bytes. Editing of hex bytes or ASCII data can be toggled by clicking on the appropriate section or pressing CTRL+TAB.
Memory Breakpoints are displayed with a green background for Read, red background for Write or a yellow background if the region contains both a read and a write breakpoint.
Any region of the CPC memory can be selected for viewing or editing. See Memory Selection for more information.
Right-clicking the memory dump pane will provide options to:
| Find | CTRL+F | Find Instructions, Text or Data. |
| Goto | CTRL+G | Position the cursor to a given hexadecimal address. |
| Select Block | Select a region of memory by entering a start and end address. | |
| Load | F5 | Load a file starting at the current selection start. |
| Save | Save the selected region to a file. | |
| Breakpoint on Read | Mark the selected region as a Breakpoint which will trigger when the memory is read from. | |
| Breakpoint on Write | Mark the selected region as a Breakpoint which will trigger when the memory is written to. | |
| Compare To | Compare the selected region to another address or the contents of a file. | |
| Fill | Fill the selected region of memory with hex data or a string. | |
| Disassemble | Disassemble the selected area of memory. | |
| Mark as Data | Mark a region of memory as a Data Area. | |
| Clear Data Area | Clear a previously set Data Area. |